




Welcome to Techinnoverse



Business Dashboard: Features, Benefits, and Why Techinnoverse is Built to Scale Your Enterprise
In an era of relentless digital transformation, data is an organization’s most valuable currency. Yet, most modern companies face the exact same roadblock: information silos. Critical numbers are scattered across CRM platforms, spreadsheets, advertising portals, inventory databases, and accounting software.
Without a unified command center, tracking performance becomes a tedious game of catch-up. This is where an intelligent, enterprise-ready business dashboard becomes the central nervous system of your business.
At Techinnoverse (techinnoverse.in), the goal of digital architecture is simple: streamline operational visibility, modernize digital workflows, and provide companies with actionable business intelligence in real time.
Below is an in-depth breakdown of what makes a high-performance business dashboard indispensable, how it operates, and why adopting this framework is critical for sustained profitability and growth.
What is a Business Dashboard?
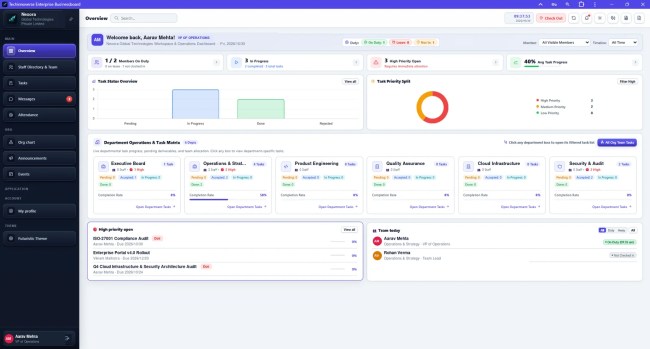
A business dashboard is an interactive information management and data visualization interface that consolidates high-level metrics, operational trends, and Key Performance Indicators (KPIs) into a unified visual screen.
Instead of parsing through multiple sheets or disparate third-party applications, managers and executives use dashboards to monitor the health of their entire operation at a glance. By combining database queries with dynamic graphs, gauges, and tables, a business dashboard transforms complex, raw data into fast, intelligible business insights.
┌──────────────────────────────────────────────────────────────┐
│                  Techinnoverse Core Data Hub                 │
└──────────────────────────────┬───────────────────────────────┘
                               │
      ┌────────────────────────┼────────────────────────┐
      ▼                        ▼                        ▼
[Operational Analytics]   [Executive KPIs]    [Role-Based Controls]
      │                        │                        │
      ▼                        ▼                        ▼
Live Workflows & Tasks   Revenue & Growth Trends  Secure Multi-Level Access
Must-Have Features of a Modern Business Intelligence Dashboard
To deliver tangible return on investment (ROI), an enterprise dashboard must do more than display static charts. A robust platform incorporates the following essential features:
1. Real-Time Data Visualization and Tracking
Business moves in seconds, not monthly cycles. Leading dashboards connect directly via webhooks and REST APIs to provide real-time updates. Whether monitoring daily active users (DAU), live sales conversions, or open support tickets, you get immediate awareness of operational spikes or sudden bottlenecks.
2. Multi-Source Integration (Single Source of Truth)
A dashboard’s true power lies in its ability to connect disparate software into one centralized pipeline. A production-ready dashboard aggregates inputs across:
- CRMs & Pipeline Tools: HubSpot, Salesforce, or custom customer databases.
- Accounting & Billing: Stripe, QuickBooks, or custom ERP systems.
- Digital Traffic & Marketing: Google Analytics 4, Search Console, and paid ad networks.
- Operational Databases: MySQL, PostgreSQL, or cloud data warehouses.
3. Customizable KPI Metrics and Thresholds
No two businesses share identical priorities. A high-value platform allows department leads to configure tailored widgets, threshold alerts (e.g., green, amber, red status signals), and target pacing bars. Executives can focus on Monthly Recurring Revenue (MRR) and Customer Acquisition Cost (CAC), while logistics leads inspect fulfillment turnaround times.
4. Granular, Role-Based Access Control (RBAC)
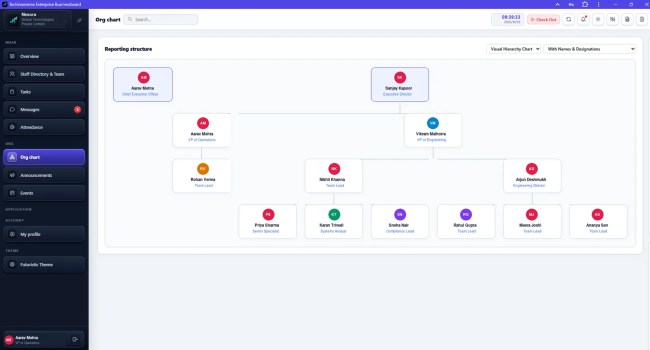
Data governance is a critical security mandate. Implementing RBAC ensures that data visibility strictly reflects corporate hierarchy. Team members access only the tools and figures relevant to their departmental responsibilities, while executive summaries and sensitive payroll metrics remain restricted to top-tier leadership.
5. Automated Reporting & Smart Alerts
Compiling weekly progress reports manually wastes hundreds of hours of high-value employee time. Modern dashboards offer automated report generation (PDF, CSV, or automated email digests) paired with event-driven notifications that trigger whenever critical thresholds—such as churn spikes or server outages—are breached.
6. Mobile-First, Cloud-Native Architecture
Leadership needs 24/7 mobility. A responsive, cross-device interface ensures that founders, directors, and field managers have secure, low-latency access to metrics from any desktop, tablet, or smartphone.
Strategic Benefits: How a Business Dashboard Drives Growth
| Strategic Pillar | Traditional Manual Management | Business Dashboard Architecture |
| Data Visibility | Fragmented spreadsheets, outdated exports | Unified single pane of glass |
| Response Time | Reactive decision-making days or weeks late | Proactive, real-time intervention |
| Reporting Overhead | Manual data entry, prone to human error | 100% automated aggregation & distribution |
| Team Alignment | Conflicting departmental numbers | Unified source of truth across all tiers |
Accelerated, Confident Decision-Making
When leadership bases strategy on stale data, costly missteps happen. A real-time dashboard removes subjective guesswork, allowing teams to spot market shifts, evaluate campaigns, and pivot capital allocations based on verified statistical reality.
Elimination of Departmental Silos
Finance, marketing, and operations frequently operate with conflicting numbers. Unifying organizational data under a single framework bridges communication gaps, ensuring every stakeholder works from identical baseline facts.
Proactive Risk Mitigation
Early warning indicators help managers head off crises before they impact quarterly margins. A sudden drop in conversion velocity or an unexpected rise in customer churn triggers instant investigation, preventing small oversights from ballooning into balance-sheet liabilities.
High Scalability Without Administrative Bloat
As an organization expands into new territories, product lines, and market segments, the volume of tracked variables grows exponentially. An automated dashboard handles escalating data loads seamlessly, preventing the need to hire dedicated reporting staff just to build spreadsheets.
The Techinnoverse Perspective: Establishing Modern Digital Infrastructure
Digital maturity begins with reliable web infrastructure. As platforms like Techinnoverse (techinnoverse.in) build out scalable web solutions, establishing a clean, secure digital framework is step one.
Transforming a base digital footprint into a fully integrated operations hub requires:
- Solid Foundation: Deploying clean code, scalable server architecture, and fast load speeds.
- Workflow Streamlining: Replacing fragmented plugins and isolated sheets with cohesive data pipelines.
- Agile Iteration: Expanding features step-by-step—from content publishing and client interaction to comprehensive performance dashboards.
For enterprises aiming to outpace competitors, deploying a data-driven business dashboard is no longer a luxury—it is an operational necessity.